Are you considering stepping into the world of homeownership? If so, you’re likely keeping a keen eye on the latest real estate trends and headlines, eager to grasp every factor that might influence your big decision. It’s not something to take lightly, of course. In this quest for knowledge, you’ve probably encountered discussions about investors and their role in the current housing market. Questions might be swirling in your mind like:
- How extensive is investor ownership in the housing market?
- Are big institutional investors, like those on Wall Street, scooping up homes to the point where it’s tough for average buyers to compete?
To help shed some light on these questions, let’s dive into the data for some real insights.
First off, let’s look at the overall picture of single-family homes (SFHs) in the U.S. and identify the portion that falls under rental properties owned by investors. Drawing from insights by SFR Investor, a group specializing in the single-family rental market, the U.S. boasts a staggering eighty-two million single-family homes.
But what’s the investor breakdown of these homes?
Recent analyses reveal a telling statistic: a whopping sixty-eight million (or by percentage 82.93%) of these homes are owner-occupied, meaning the owners live or reside in the homes that they own. Doing the math, this leaves about fourteen million homes as single-family rentals.
Now, are all these rentals in the hands of massive institutional investors? The reality is far from it. Let’s categorize the investors to paint a clearer picture:
- The ‘mom & pop’ investor, holding 1-9 SFRs.
- The regional investor with a portfolio of 10-99 SFRs.
- The smaller national investor owns 100-999 SFRs.
- The institutional investor, with a substantial count of over 1,000 SFRs.
Understanding the Investors’ Numbers through Charts
This classification reveals a diverse investment landscape where not all players are towering institutional entities. To illustrate this more vividly, let’s look at the distribution of rental homes owned by each investor type (refer to the accompanying chart).
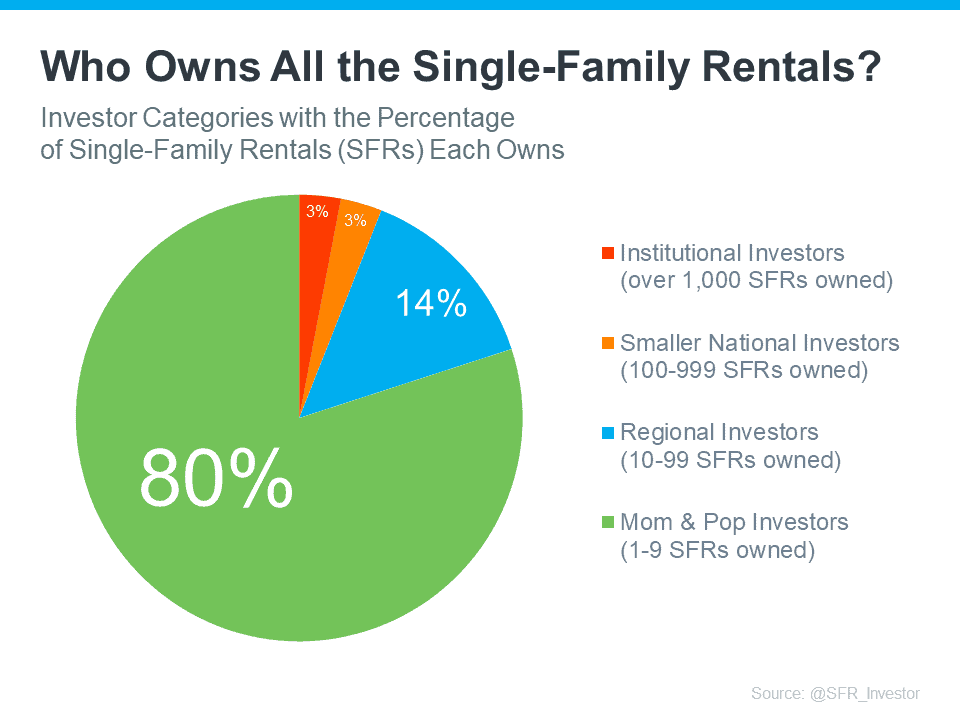
As the chart clearly indicates, contrary to popular belief fueled by news and social media narratives, a significant majority of these properties aren’t in the hands of large institutional investors. Instead, they’re predominantly owned by smaller, ‘mom & pop’ investors – they could very well be people in your own community.
The real story here is about individuals who, much like yourself, value the concept of homeownership. They see purchasing a home, or perhaps a second one, as a sound investment. For some, the past few years presented opportunities to buy additional properties for rental purposes, adding a source of income. Others chose to retain their first homes as valuable assets when moving to larger spaces.
Therefore, it’s important to approach the narratives about institutional investors with a critical eye. The fear that they are monopolizing the housing market, making it unattainable for the average person, is not backed by the data. In fact, institutional investors represent the smallest slice of the ownership pie chart.
Final Thoughts
Indeed, it’s important to recognize that while institutional investors do have a presence in the single-family rental market, the notion that they’re snapping up every available property is far from accurate. In reality, there’s much more to the story. If you’re encountering mixed messages or confusing headlines about the housing market, don’t hesitate to reach out. Connecting with an expert like the McT Real Estate Group can provide you with the clarity and context you need to navigate these waters confidently. We’re here to demystify the process and ensure you have all the accurate information at your fingertips.